A better Task Manager for Windows 11

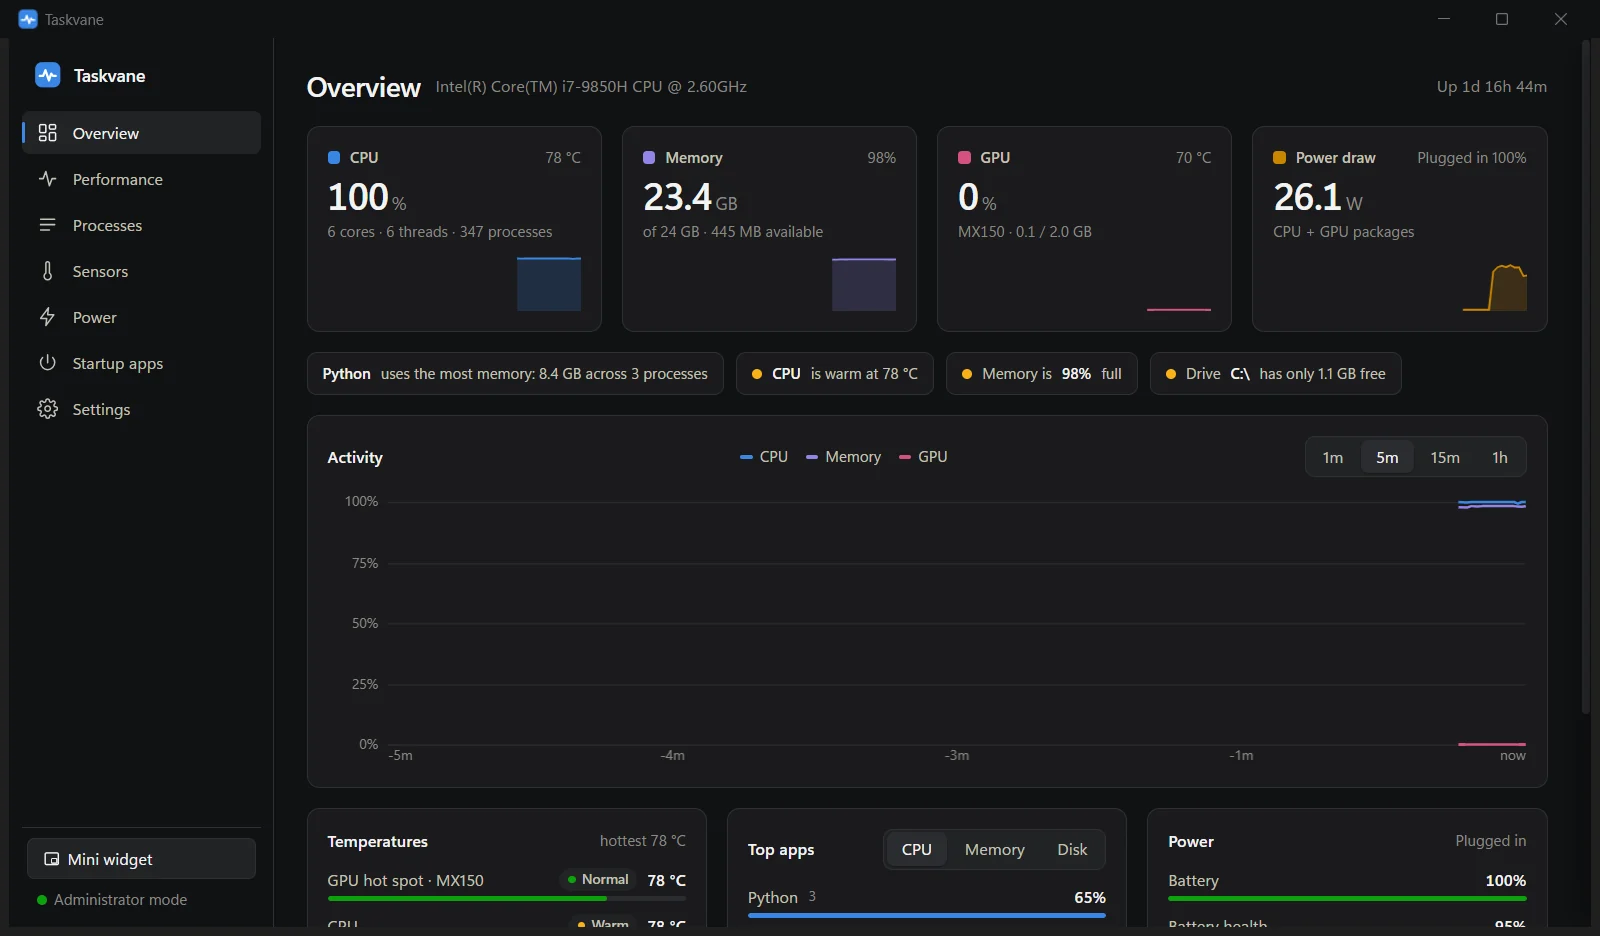
Taskvane shows what Task Manager does, plus the things it leaves out: CPU and GPU temperatures, power draw in watts and battery health. It's free, open source, and light enough to leave running.

Version 1.2.0, 28 MB. For Windows 10 and 11, 64-bit. Portable version and checksums

Taskvane overview showing CPU at 78 °C, memory, GPU and 26 W power draw with an activity chart

How hot is too hot?

Task Manager can't tell you. Drag the marker to see what your CPU temperature means and how Taskvane would show it.

82 °CWarm

Typical while gaming or exporting video. Fans spin up, and that's expected.

Normal
below 70 °C
Warm
70 to 84 °C
Hot
85 to 94 °C
Critical
95 °C and up

Every core, not a guess

See the temperature of each CPU core and the package, the GPU core and its hot spot, and your SSDs, with the minimum and maximum since you opened the app.

Each reading is labelled Normal, Warm, Hot or Critical, so you know at a glance whether something is wrong.

How temperatures work
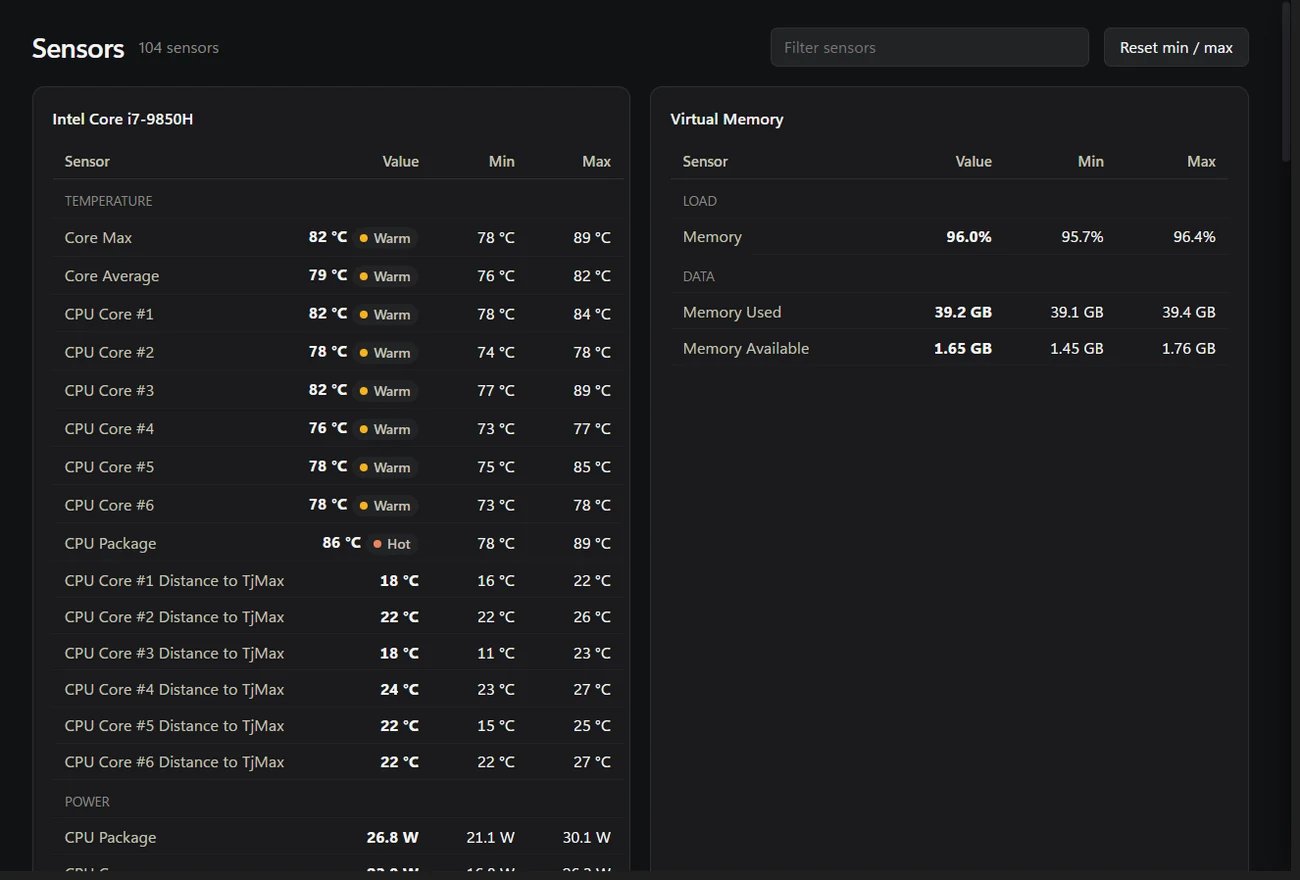
Taskvane Sensors page listing each CPU core temperature with Normal, Warm and Hot labels, plus CPU package power

Know where your watts go

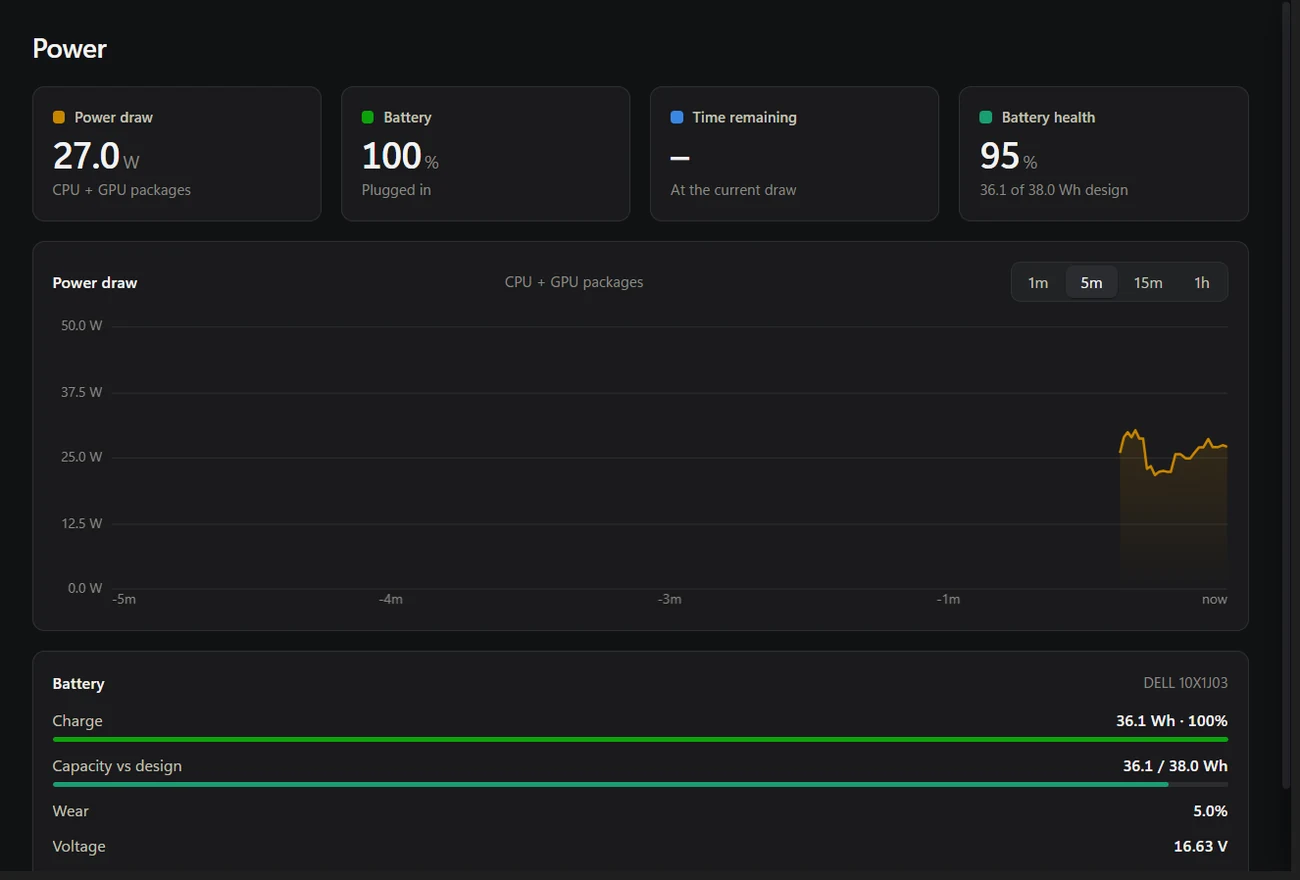
On battery, Taskvane shows the whole laptop's power draw in watts and how long the charge will last at that rate. With admin rights it adds CPU and GPU package power.

It also shows battery health: how much charge your battery can still hold compared with when it was new.

About power readings
Taskvane Power page with a power draw chart in watts and battery capacity versus design capacity

Apps, not a wall of processes

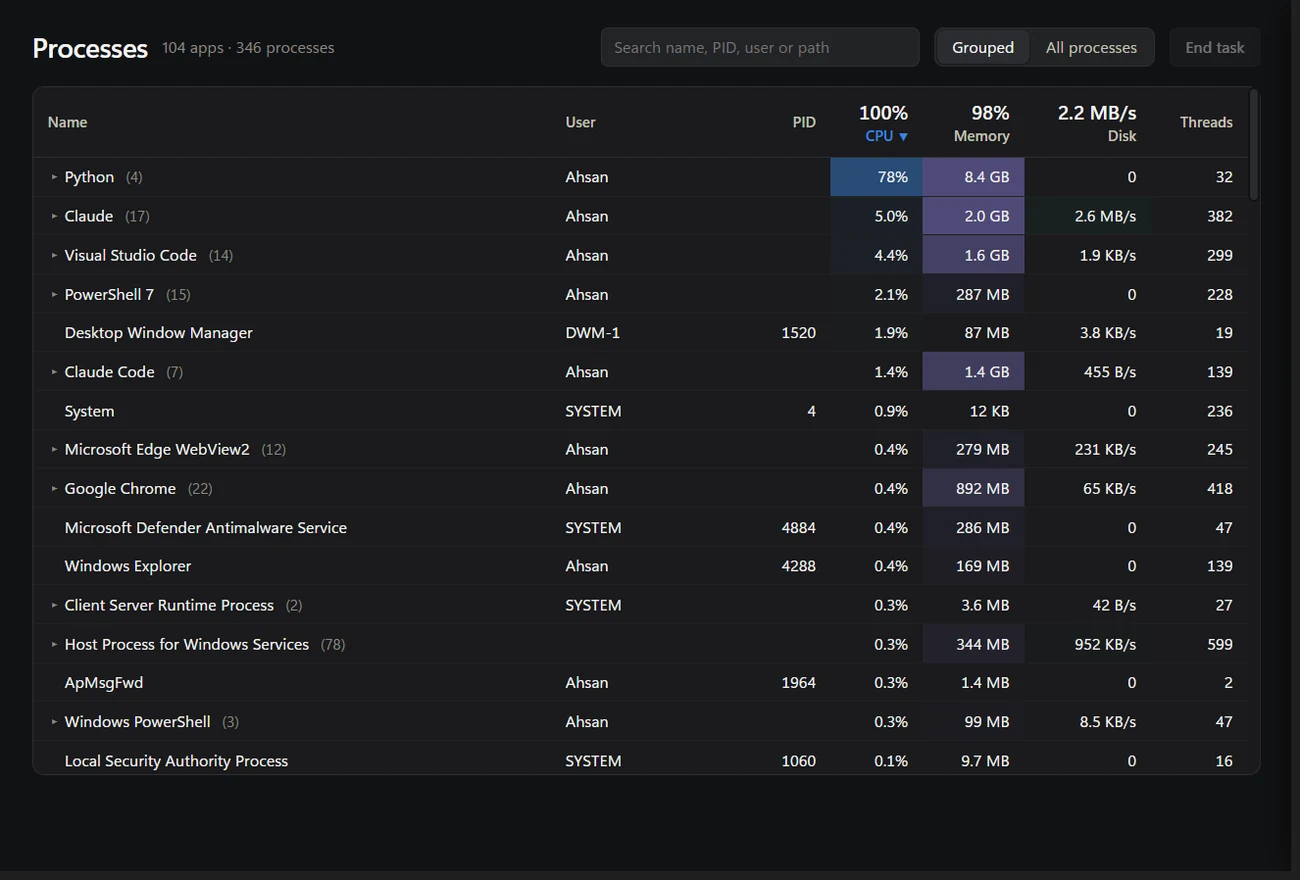
Processes are grouped under the app's real name, like "Google Chrome" rather than 25 copies of chrome.exe, with combined CPU, memory and disk.

Right-click to end a task or a whole process tree, change priority, open the file location or see details. Startup apps get their own page.

Process tools
Taskvane process list grouped by app, showing CPU, memory and disk use per app

Look back an hour, not a minute

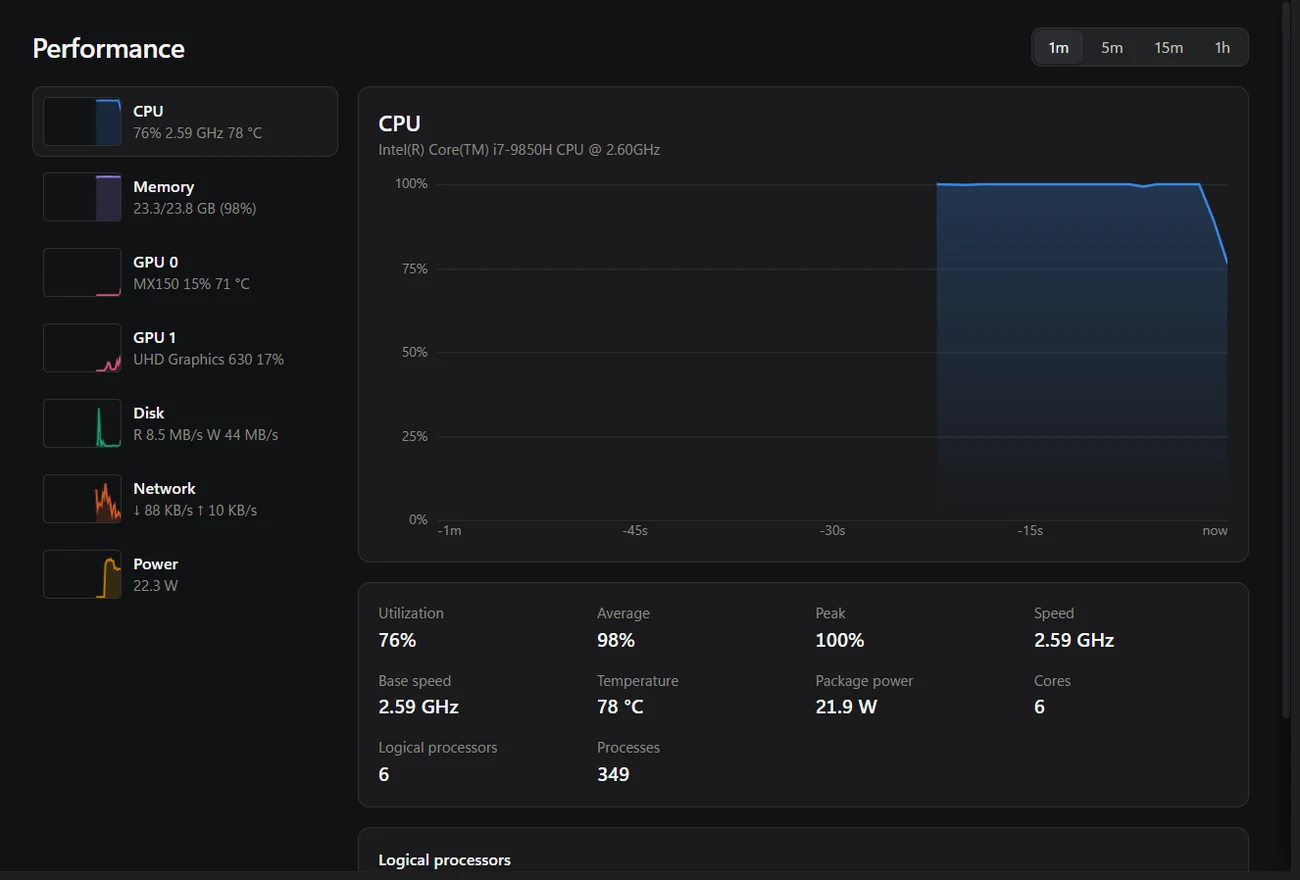
Performance graphs for CPU, memory, every GPU, disk, network and power go back up to an hour. Hover anywhere to read the exact value at that moment.

Export the last hour as a CSV file when you need to prove a problem or compare runs.

Performance graphs
Taskvane Performance page with a CPU usage graph, per-core load and real clock speed

Built to stay out of the way

A monitor that slows your PC down defeats the point. With the window open, Taskvane uses about 0.4% of the CPU on a 2019 laptop.

It reads every process in a single Windows system call, the same source Task Manager uses, instead of opening each one. Hardware sensors run in a separate helper process, so a misbehaving driver can't freeze the window.

Taskvane next to Task Manager

Task Manager is still great for services and per-app network use. Taskvane covers the hardware side it skips.

What you can seeTask ManagerTaskvane
CPU, memory, disk, network and GPU usageYesYes
CPU core and package temperatureNoYes
GPU temperatureDedicated GPUs onlyYes, plus hot spot
Power draw in wattsNoYes
Battery health and time left at the current drawNoYes
Alerts for heat, memory and low batteryNoYes
History graphsLast 60 secondsUp to 1 hour, with CSV export
Always-on-top mini widgetNoYes
Services, users and per-app network useYesNo

More detail: Taskvane vs Task Manager, vs HWiNFO and vs LibreHardwareMonitor.

Free, and yours to inspect

No ads, no account, no telemetry. The full source is on GitHub under the GPL-3.0 license, and every release lists SHA-256 checksums.