What Taskvane shows you
Everything Task Manager covers for apps and usage, plus the hardware readings it leaves out. Here's each part of the app and what it's for.
Overview
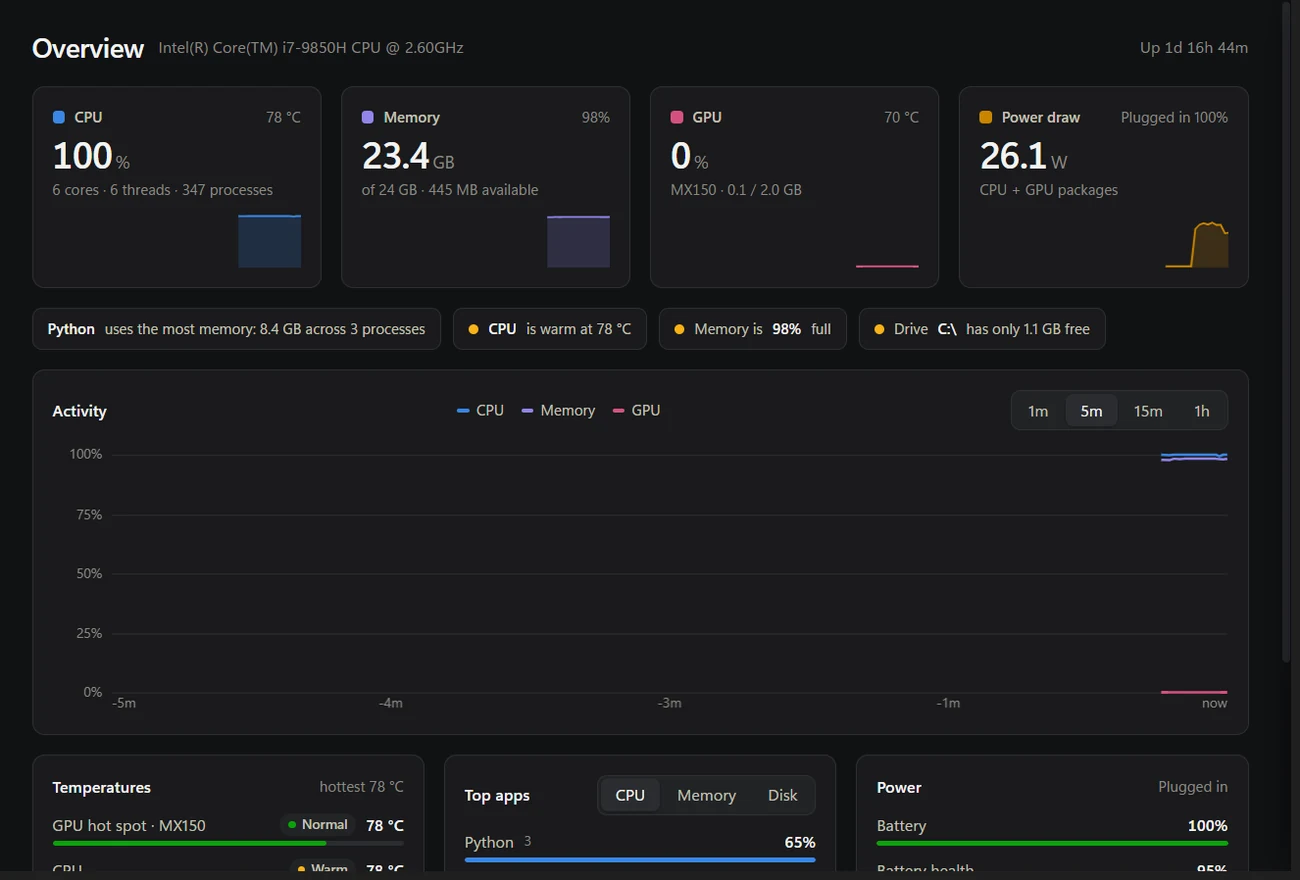
The first screen answers "is my PC okay?" in one glance: CPU, memory, GPU and power tiles with short history lines, an activity chart, the hottest temperatures and the apps using the most resources.
Above them, plain-language notes call out anything unusual, like an app using 8 GB of memory, a CPU running warm, memory almost full or a drive running out of space.
Temperatures
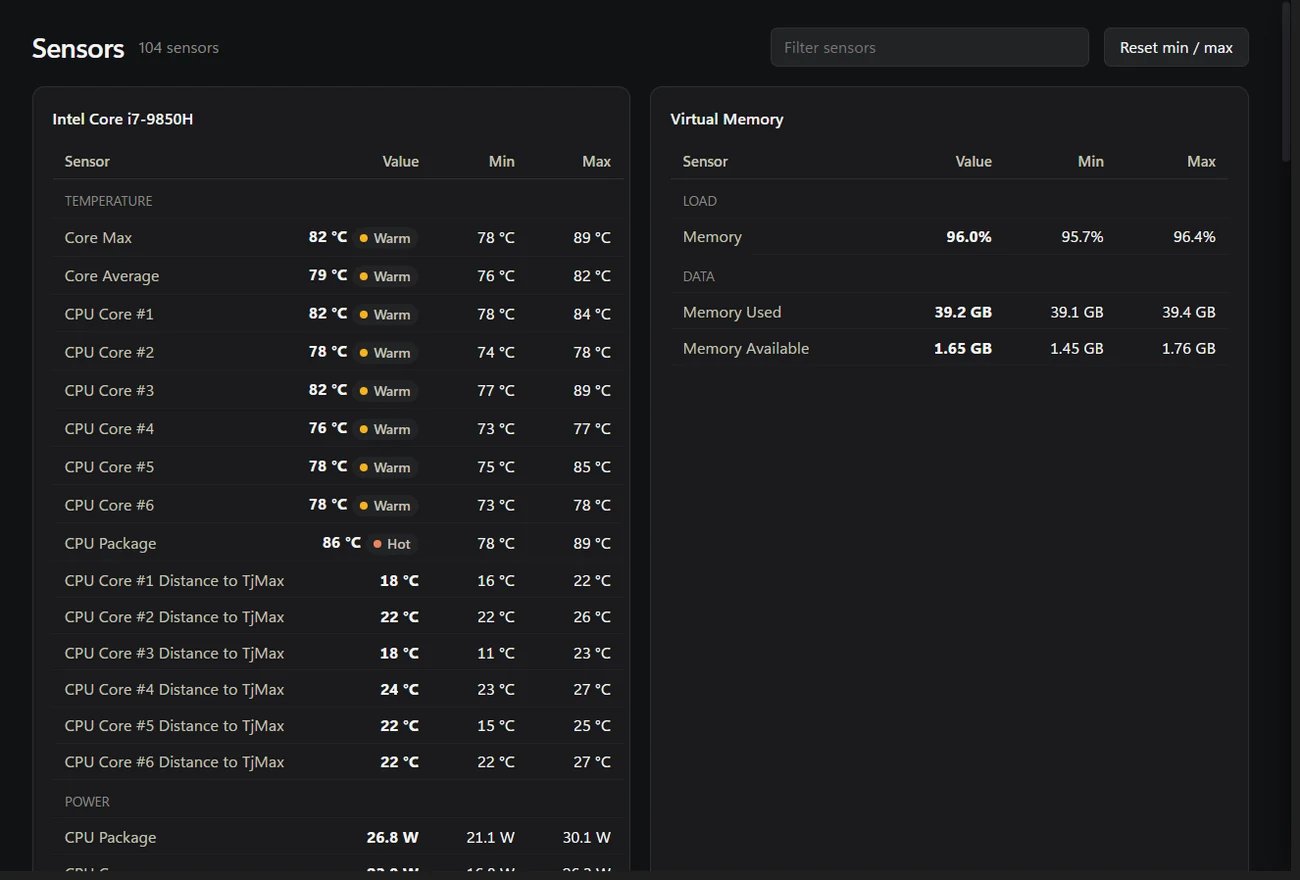
Taskvane reads the same sensors as LibreHardwareMonitor: every CPU core and the CPU package, the GPU core and its hot spot (the hottest point on the chip), and SSD temperatures. Each reading is labelled Normal, Warm, Hot or Critical, with the lowest and highest values since the app opened.
GPU temperatures work straight away. CPU and drive temperatures need administrator mode, because Windows only exposes them to elevated apps; see how to turn them on.
Power and battery
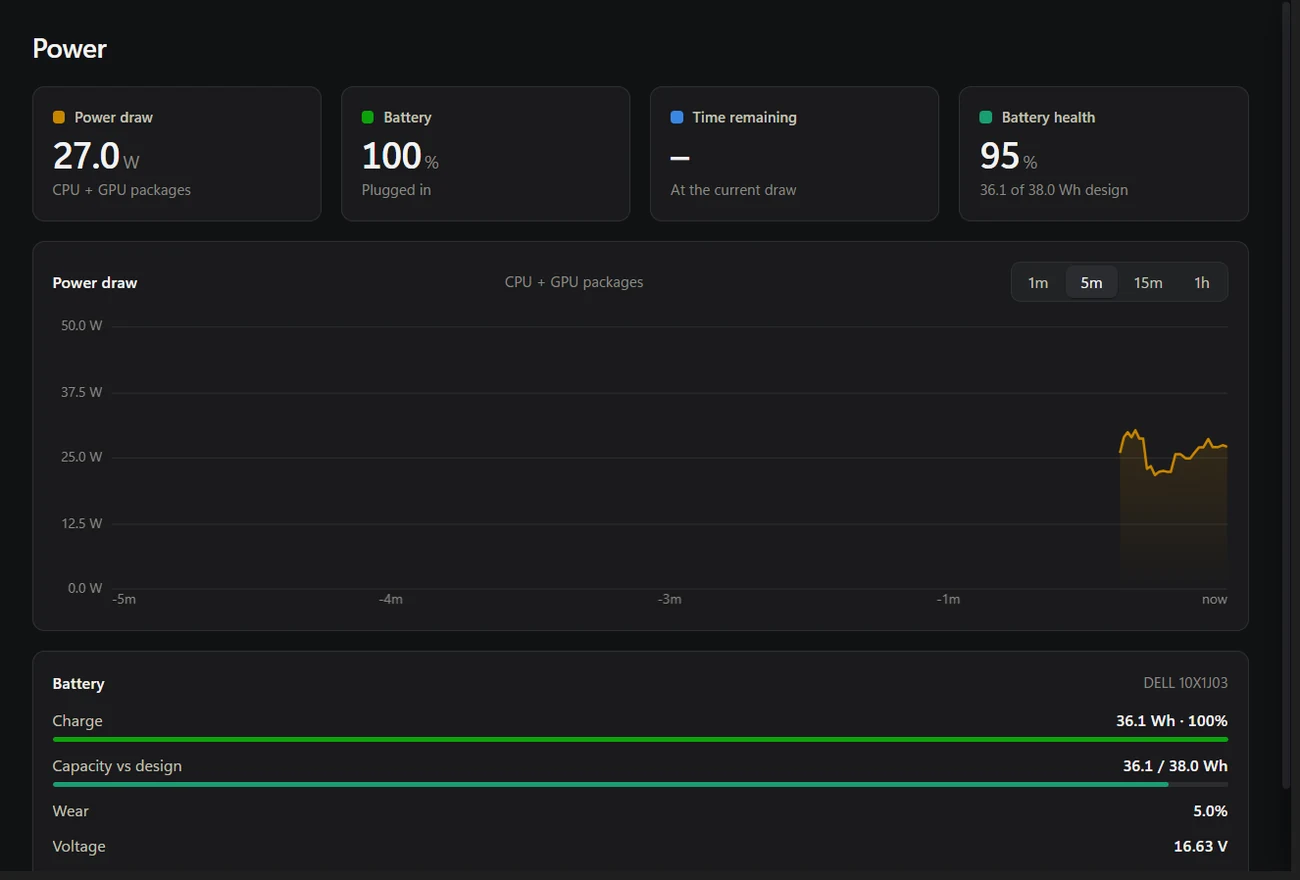
On battery, Taskvane shows the whole laptop's power draw in watts, measured at the battery, and how long the charge will last at that rate. Plugged in, Windows doesn't report whole-system power, so Taskvane shows CPU and GPU package power instead (administrator mode).
The Power page also shows battery health: the capacity your battery holds now compared with its design capacity, plus wear and voltage, and the energy used on battery since you opened the app.
Processes and startup apps
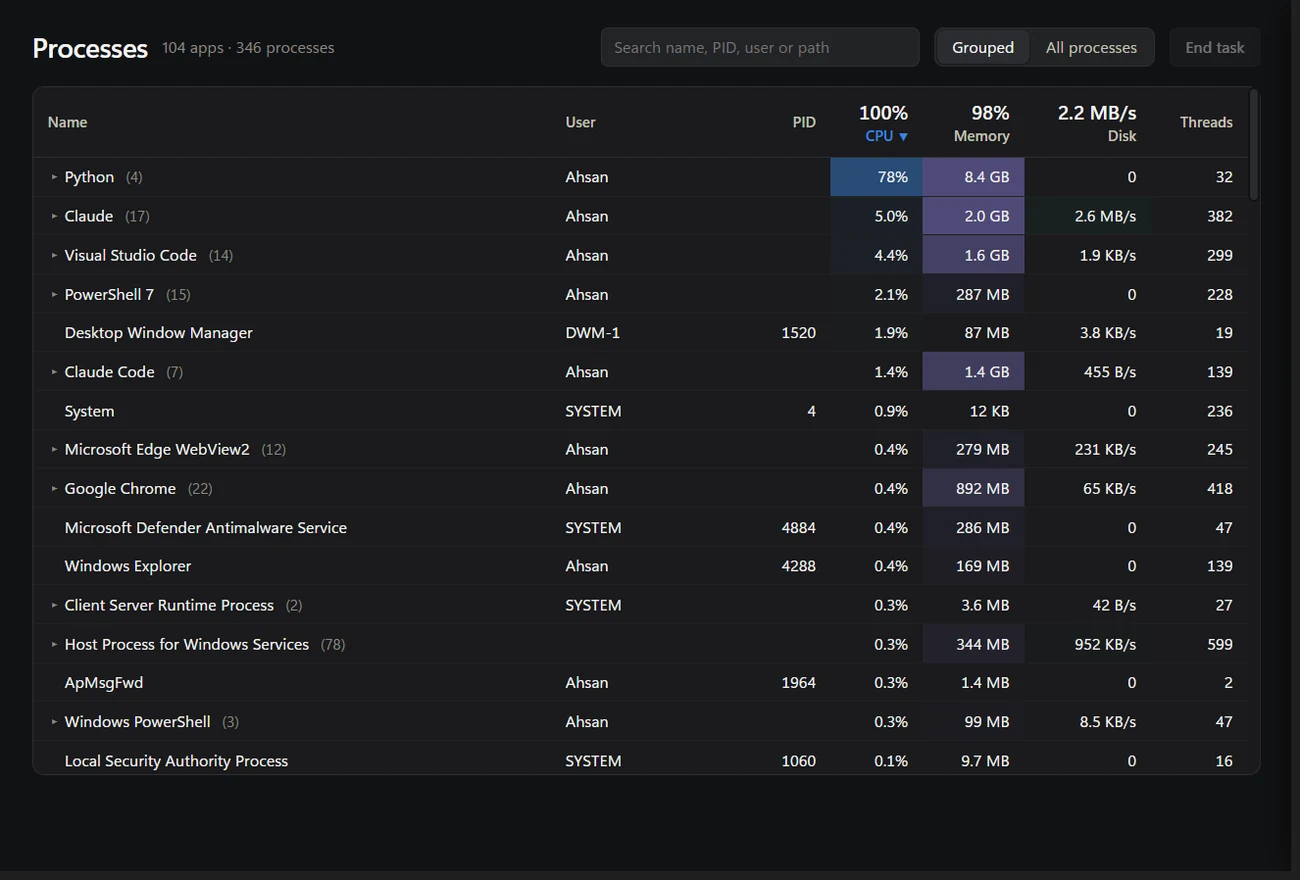
Processes are grouped under the app's real name, taken from the program itself: "Google Chrome" instead of 25 copies of chrome.exe. Expand a group to see each process. Sort by CPU, memory or disk, or search by name, process ID, user or file path.
Right-click any app to end it or its whole process tree, change its priority, open its file location, search for it online or see details like its command line and memory breakdown. The Startup apps page turns startup entries on or off the same way Task Manager does.
Performance graphs
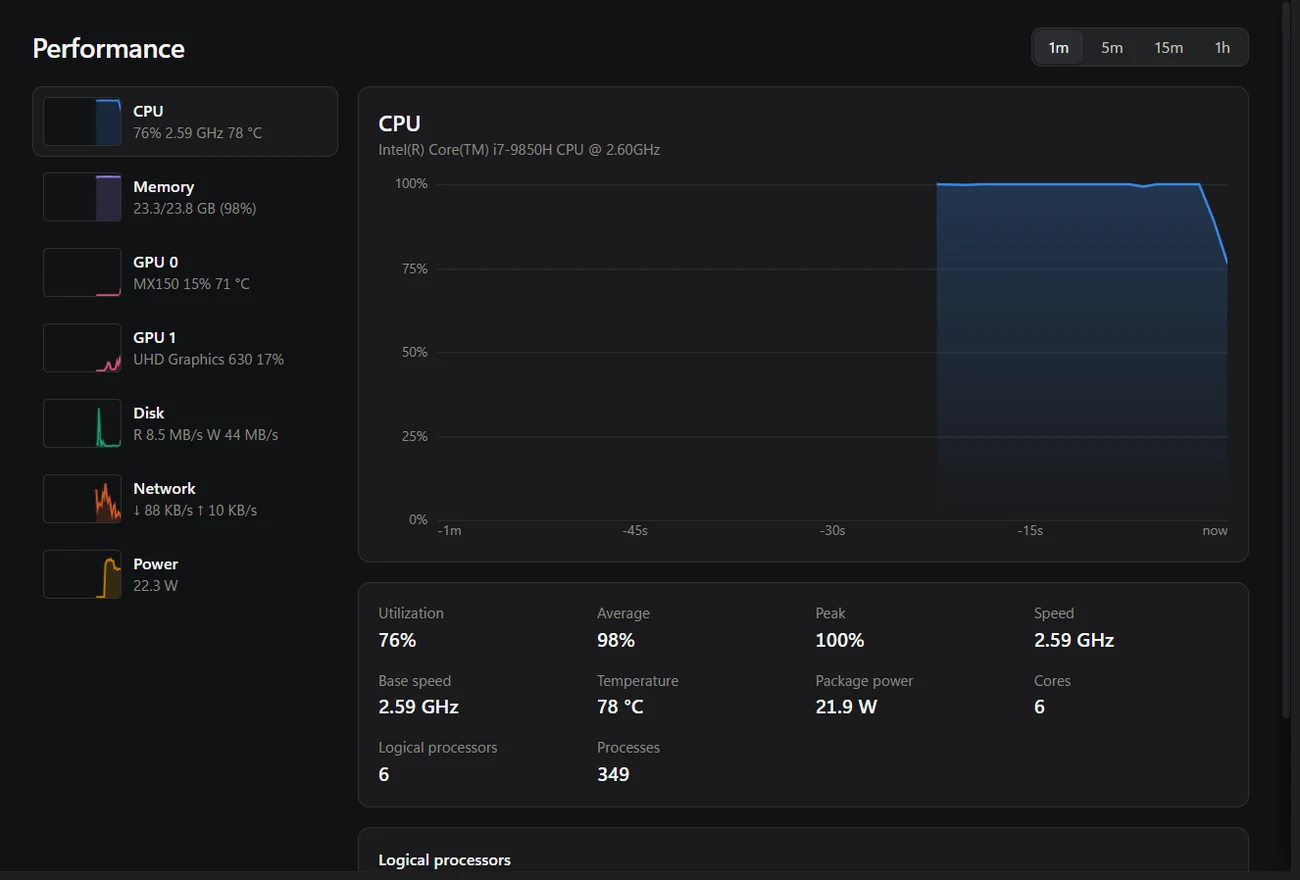
Separate graphs for the CPU (with load and clock speed per core), memory, each GPU, disk, network and power. Switch between the last minute, 5 minutes, 15 minutes or hour, and hover anywhere on a graph to read the exact values at that moment.
Export the last hour to a CSV file from Settings to keep a record or compare two runs.
Alerts and the mini widget
Taskvane can send a Windows notification when the CPU or GPU gets too hot, memory fills up, the battery runs low, or the CPU stays busy for over a minute. You set each threshold, and each alert repeats at most every 10 minutes.
The mini widget is a small always-on-top panel with CPU, memory, GPU, power and battery, for keeping an eye on things during a game or a long export. The notification-area icon can show a live number too.
Lightweight by design
Taskvane uses about 0.4% of the CPU with its window open. It reads all process statistics in one Windows system call, the same source Task Manager uses, and hardware sensors run in a separate helper process that restarts itself if a driver misbehaves.